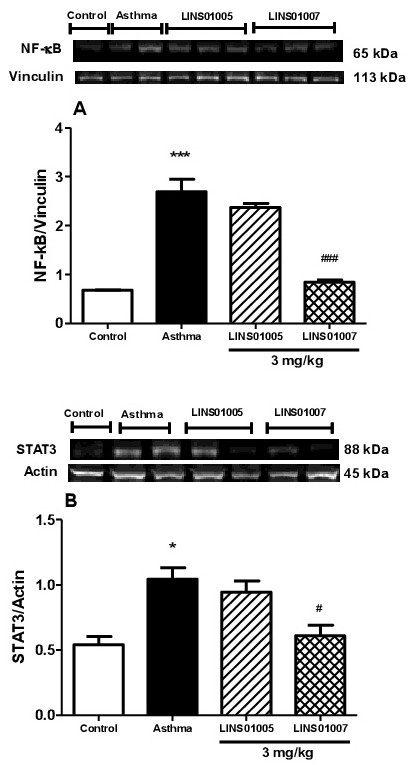
Fig. 5. Effect of treatment with LINS01005 and LINS01007 on the NF-κB and STAT3 expression. Lungs were collected 24h after the second challenge to quantify the NF-κB expression (A) and STAT3 (B) by Western Blot. Graphs represent the density values of bands that were determined by densitometric analysis and normalized by the total vinculin or actin present in each lane. Results are the mean ± S.E.M. of 5 animals in each of 3 independent experiments. **p<0.01 and ***p<0.001 in comparison with the control group and # p<0.05 and ### p<0.001 in comparison with the asthma group.